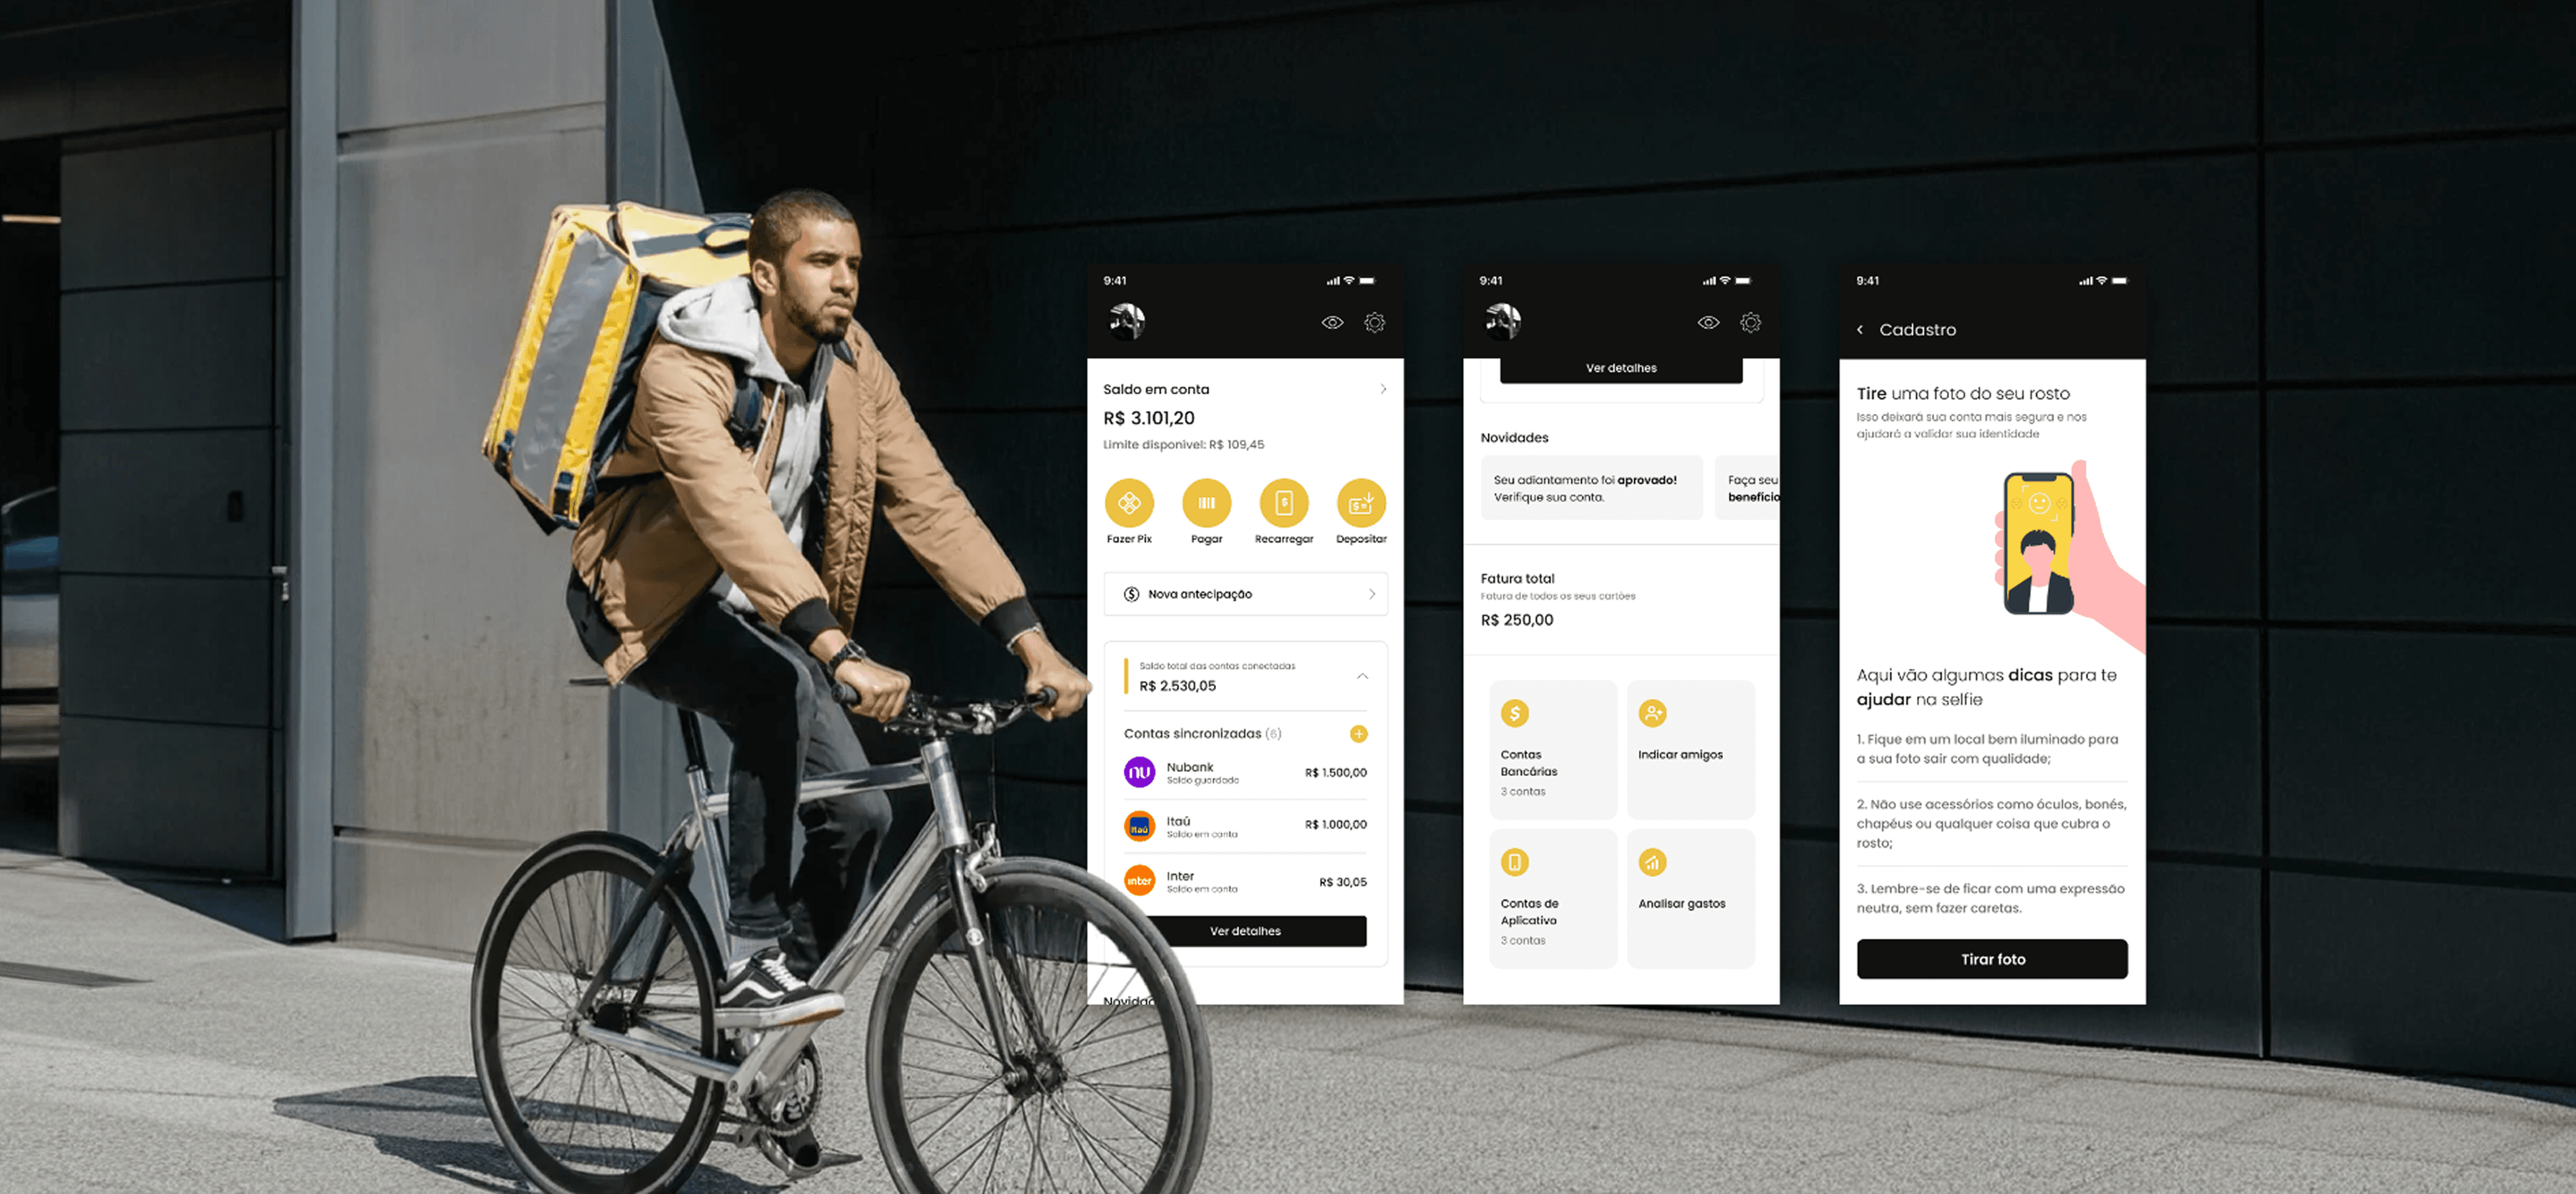
Offers intelligent solutions for industrial monitoring, increasing the reliability and efficiency of equipment.
Condition Monitoring Overview
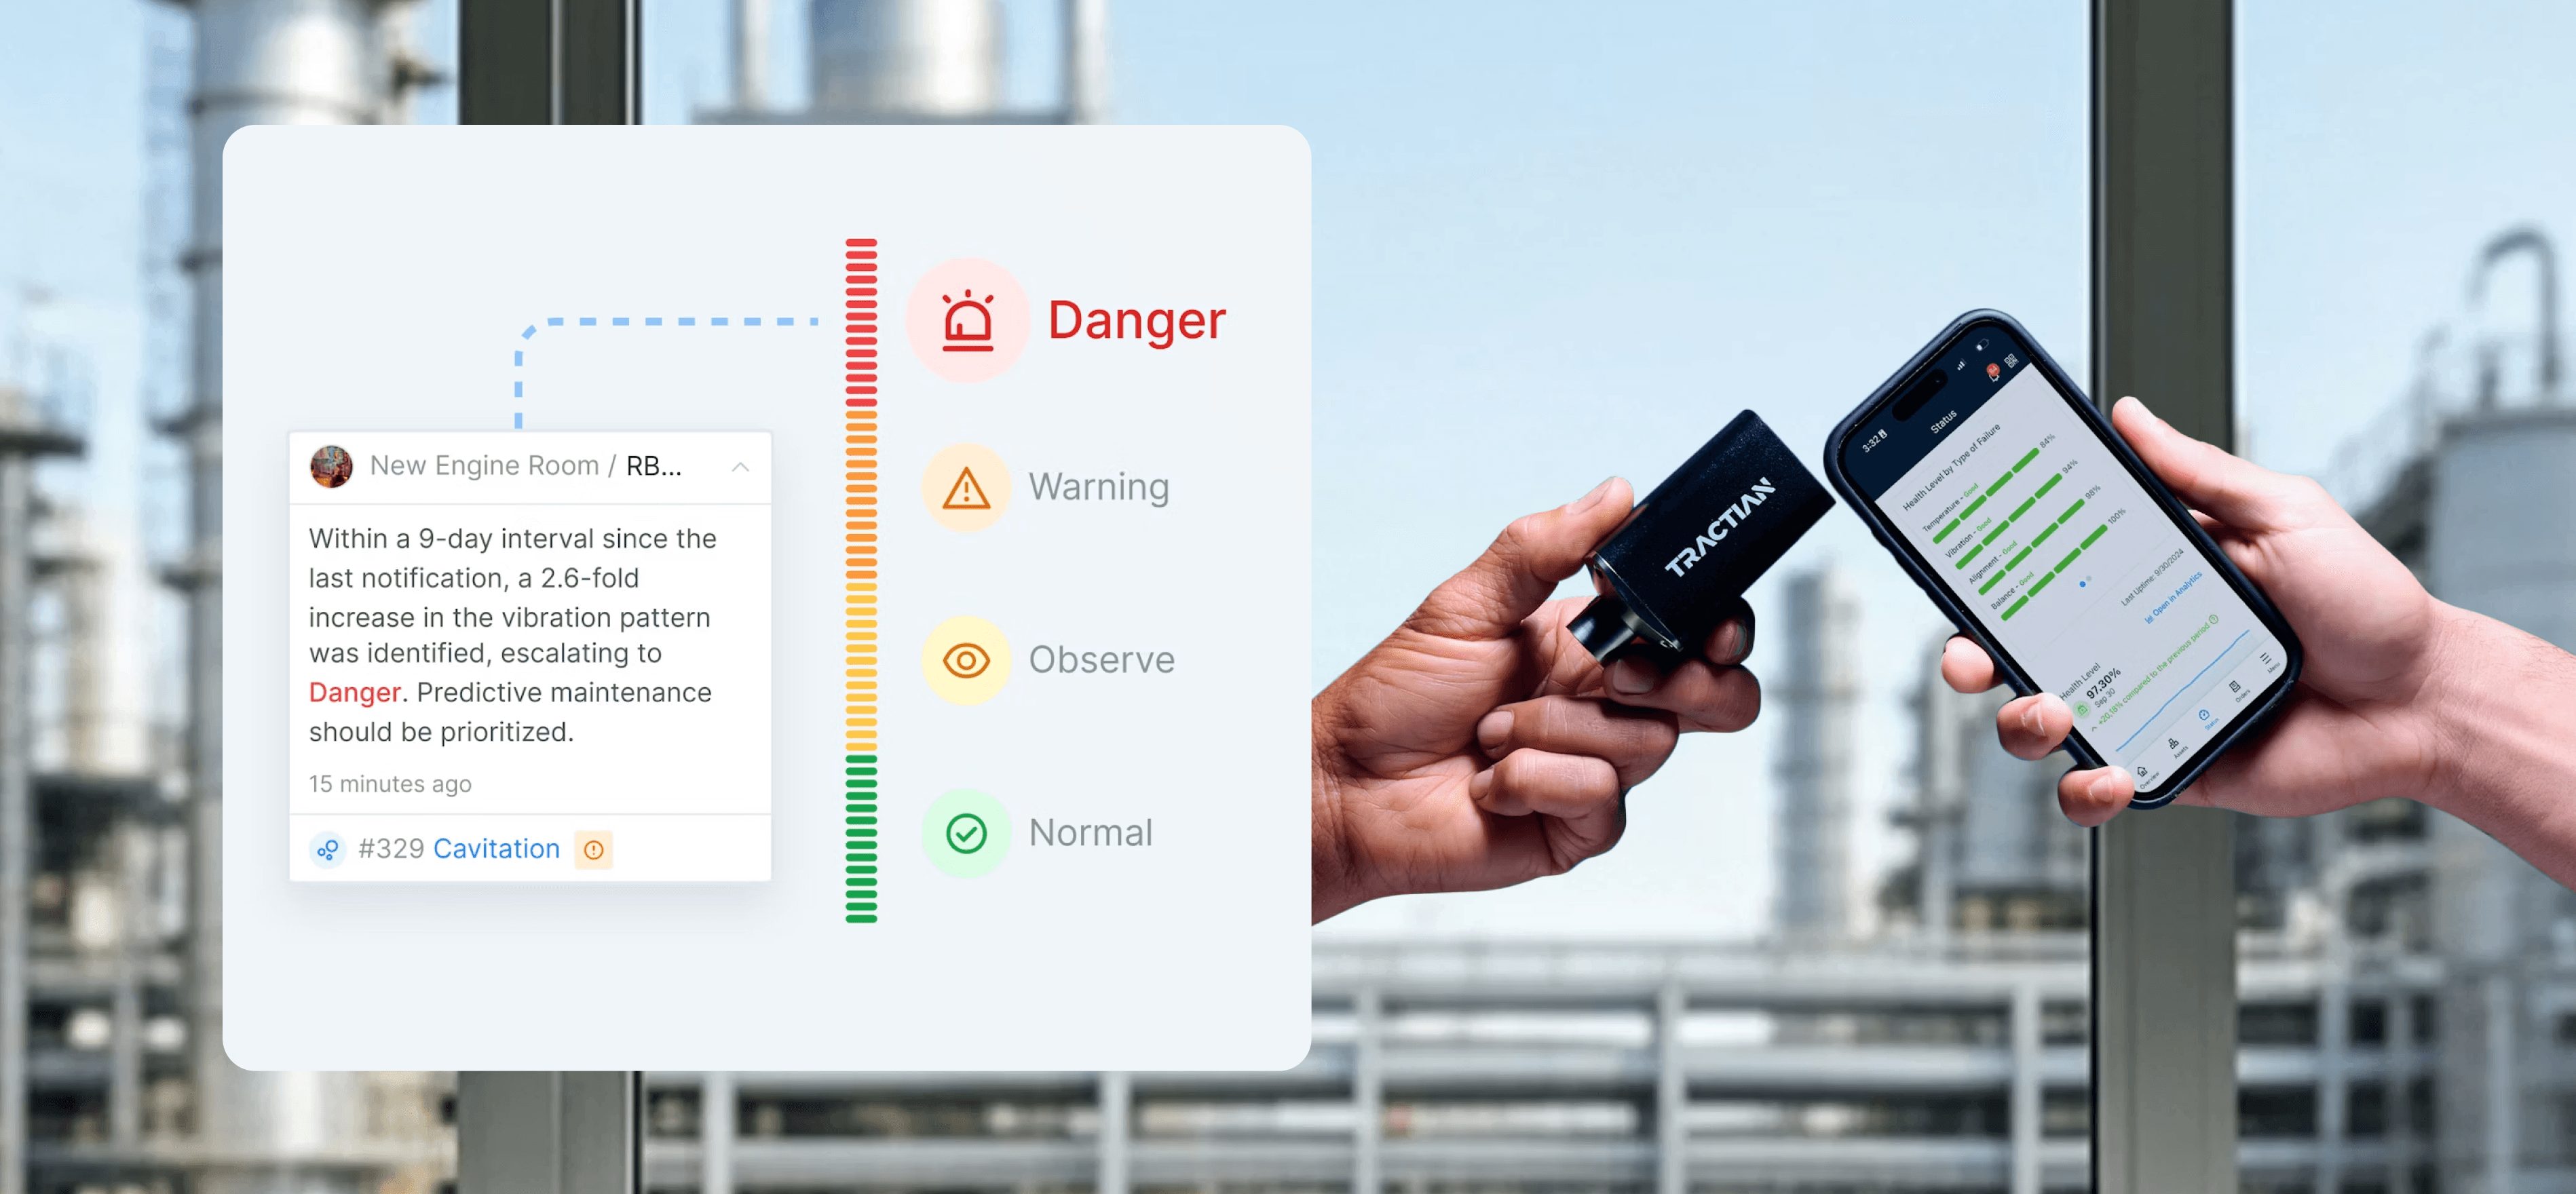
Main page of the Tractian platform. It provides a comprehensive overview of the status of the assets monitored by a company's TRACTIAN sensors.
Prioritizing equipment based on health condition
We redesigned the platform's Overview to facilitate understanding of what needs to be done now and what can wait. This is very important as we have companies with over 1,000 monitored equipments and only 3 people to manage them.

Lack of direction and a sense of urgency
Not all equipment failures are the same or at the same stage. The failure detection model alerts the client days or months before it actually poses an imminent risk. Some early-stage failures are not even perceived by human senses. This means that maintenance can wait until it is close to becoming a problem.
 Immediate correction
If all failure alerts have the same importance, it means that nothing is a priority.
The update of statuses
The statuses changed according to user actions, not the true condition of the equipment. Whenever a failure insight was generated, the asset entered the Alarming status. After the client addressed the Insight, assigning an inspection (to verify the failure) or event (to confirm the failure), the equipment's status was updated to Warning. The true condition of the asset was not taken into account. Thus, the client could be prioritizing the correction of a less severe failure over another.
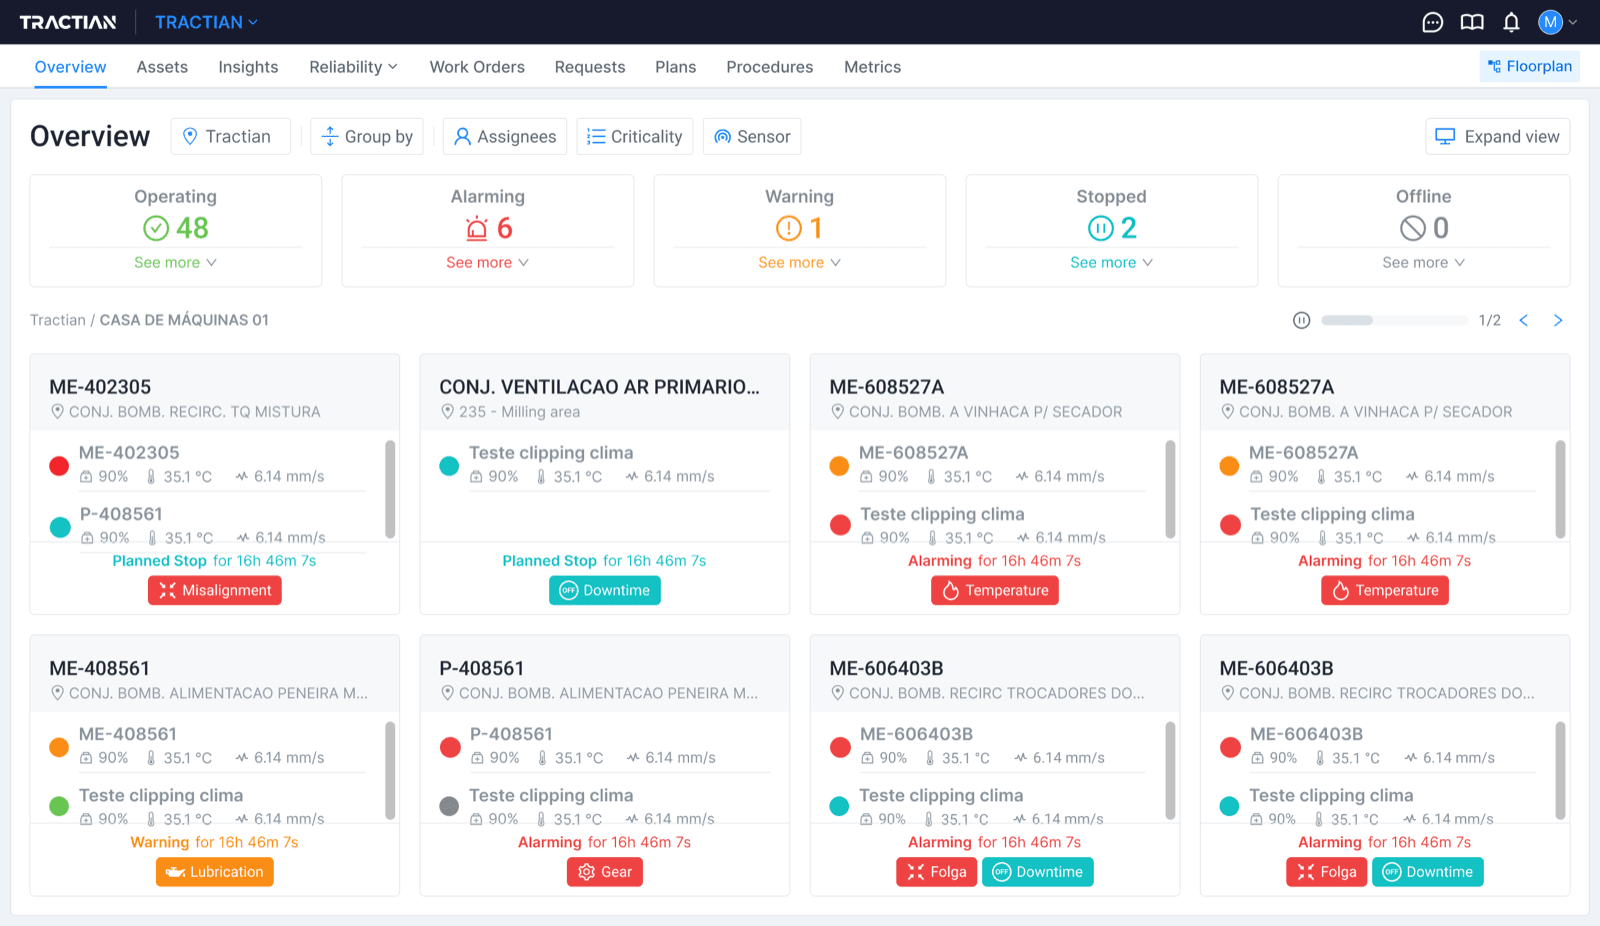
Condition x Operation
When equipment in Alarming or Warning status was out of Operation, the status was updated to Stopped. This caused the user to lose the real information about the condition of the equipment, generating a false sense that their equipment was operating as expected. Just like the offline status. Whenever the sensor was offline, the condition or operation statuses were overwritten.

Consequences of an inefficient page
This accumulation delivers various negative results that directly influence the ROI of our product's hiring.
1. Stack of unchecked insights
Since everything has the same priority, the sense of urgency is lost.
2. Outdated failure detection models
The lack of checking insights harms failure detection models by not receiving user feedback.
3. Reduced accuracy (false positive)
The lack of clarity about a failure being in an early stage increases the number of insights checked as 'No Failure'.
4. Elevated average time to check
Insights take a considerable amount of time to verify, since they all have the same priority.
Change the entire designed structure and create a new prioritization model with AI
We updated the Condition statuses to clarify when a piece of equipment truly needs attention. Now the statuses are defined purely by Artificial Intelligence and only return to Normal status when there are no pending issues linked to the equipment.
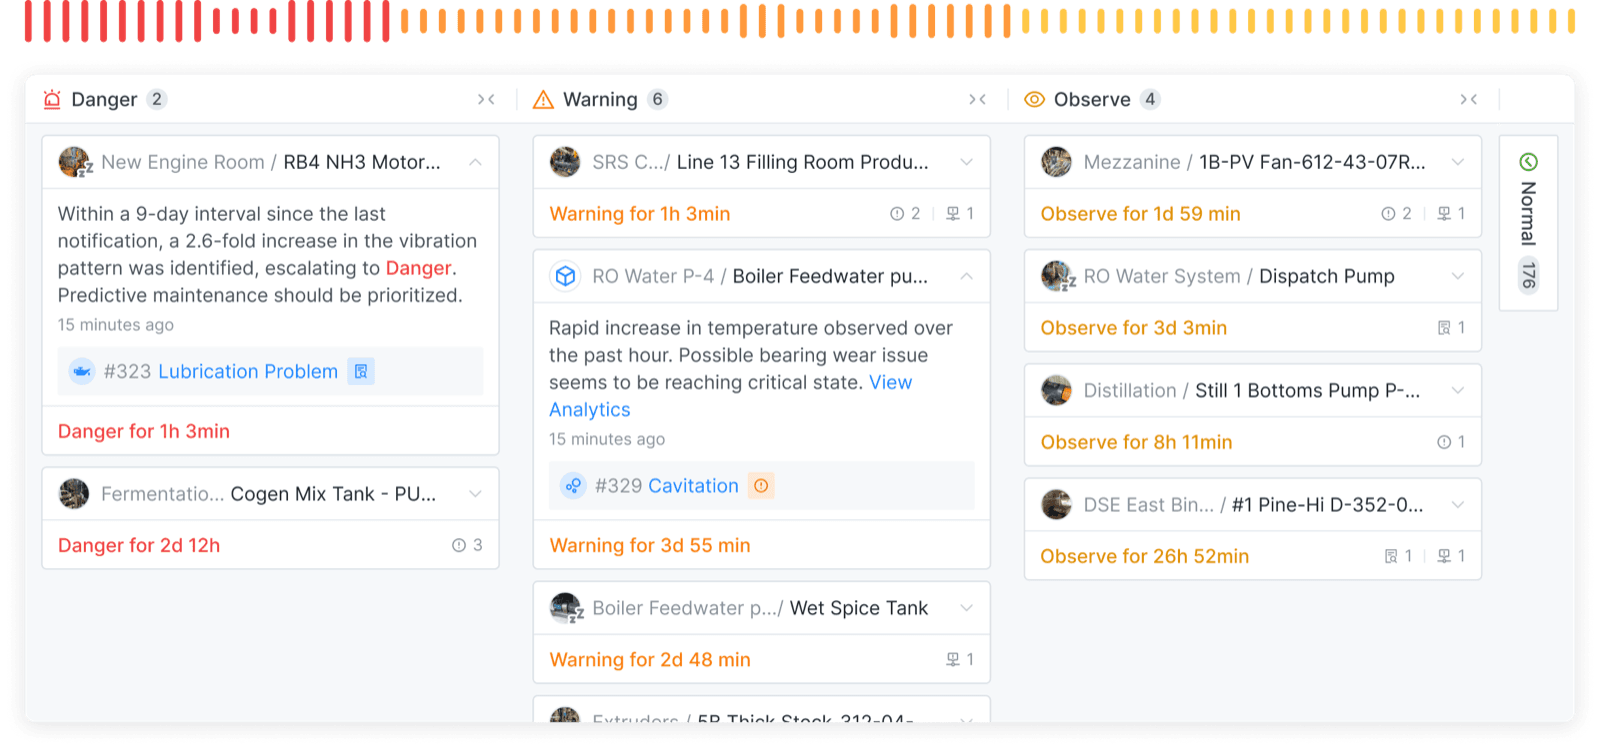
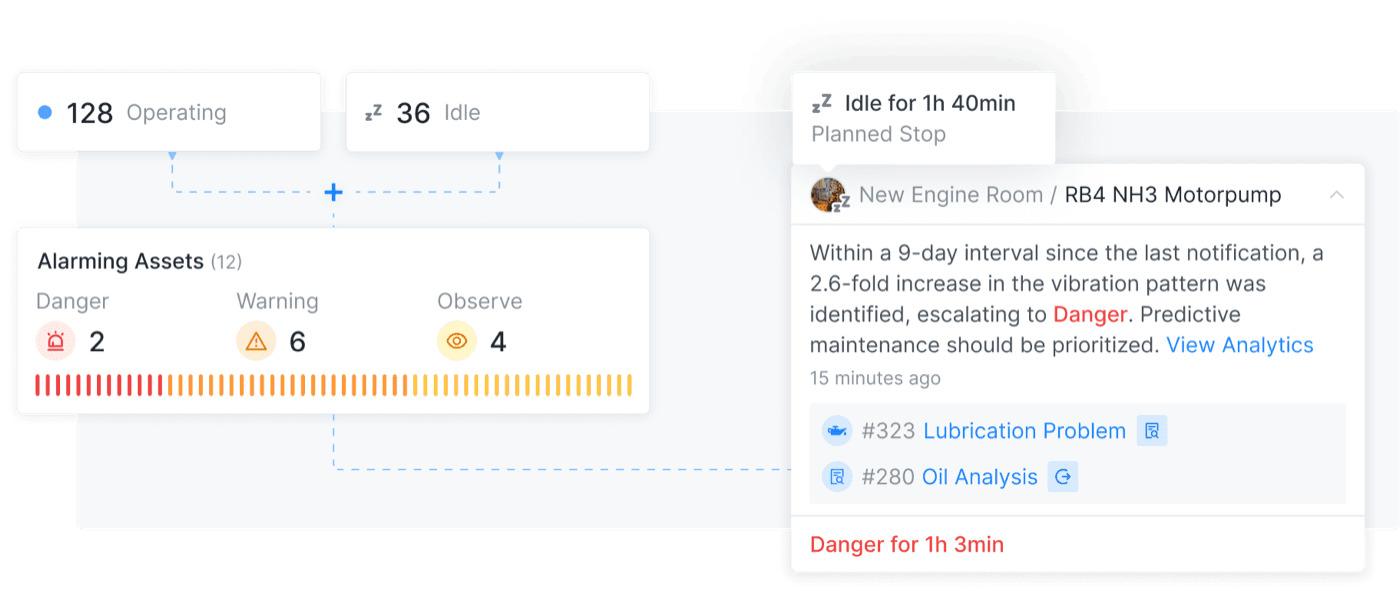
Now the Condition and Operation statuses work together. One does not negate the other. This means I can see if the equipment is operating and what its specific condition is.
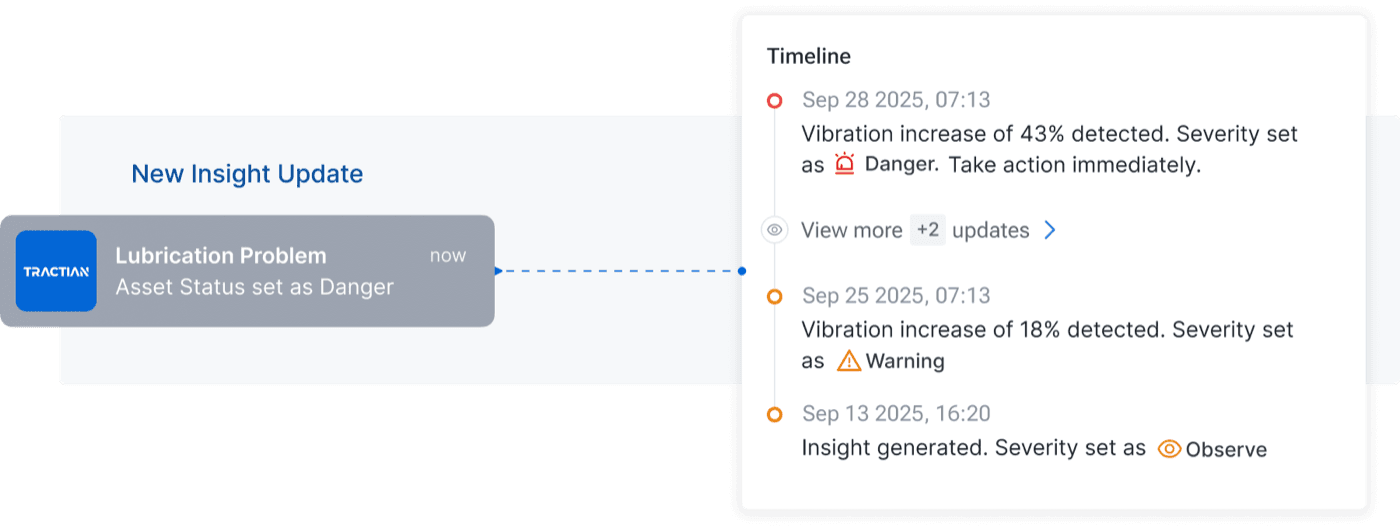
We added a timeline to the Insight to highlight the deterioration and/or improvement of the equipment over time.
The precision of a design that fulfills its role
1. The number of clicks to check has been reduced from 11 to 4
Same task, but it's easier to spot outstanding issues.
2. The Average Time to Check has been reduced from 10 hours to 2h 43min
By directing where the user should allocate their time, we help reduce their cognitive load and increase their productivity.
3. The percentage of checked insights increased by 28%
This means that the failure detection models are being better trained and are delivering more accurate results.
4. We increased the average number of failures recorded per month by 37%
This means a higher ROI for our client and consequently an upsell on contract renewal.
An experience for each device
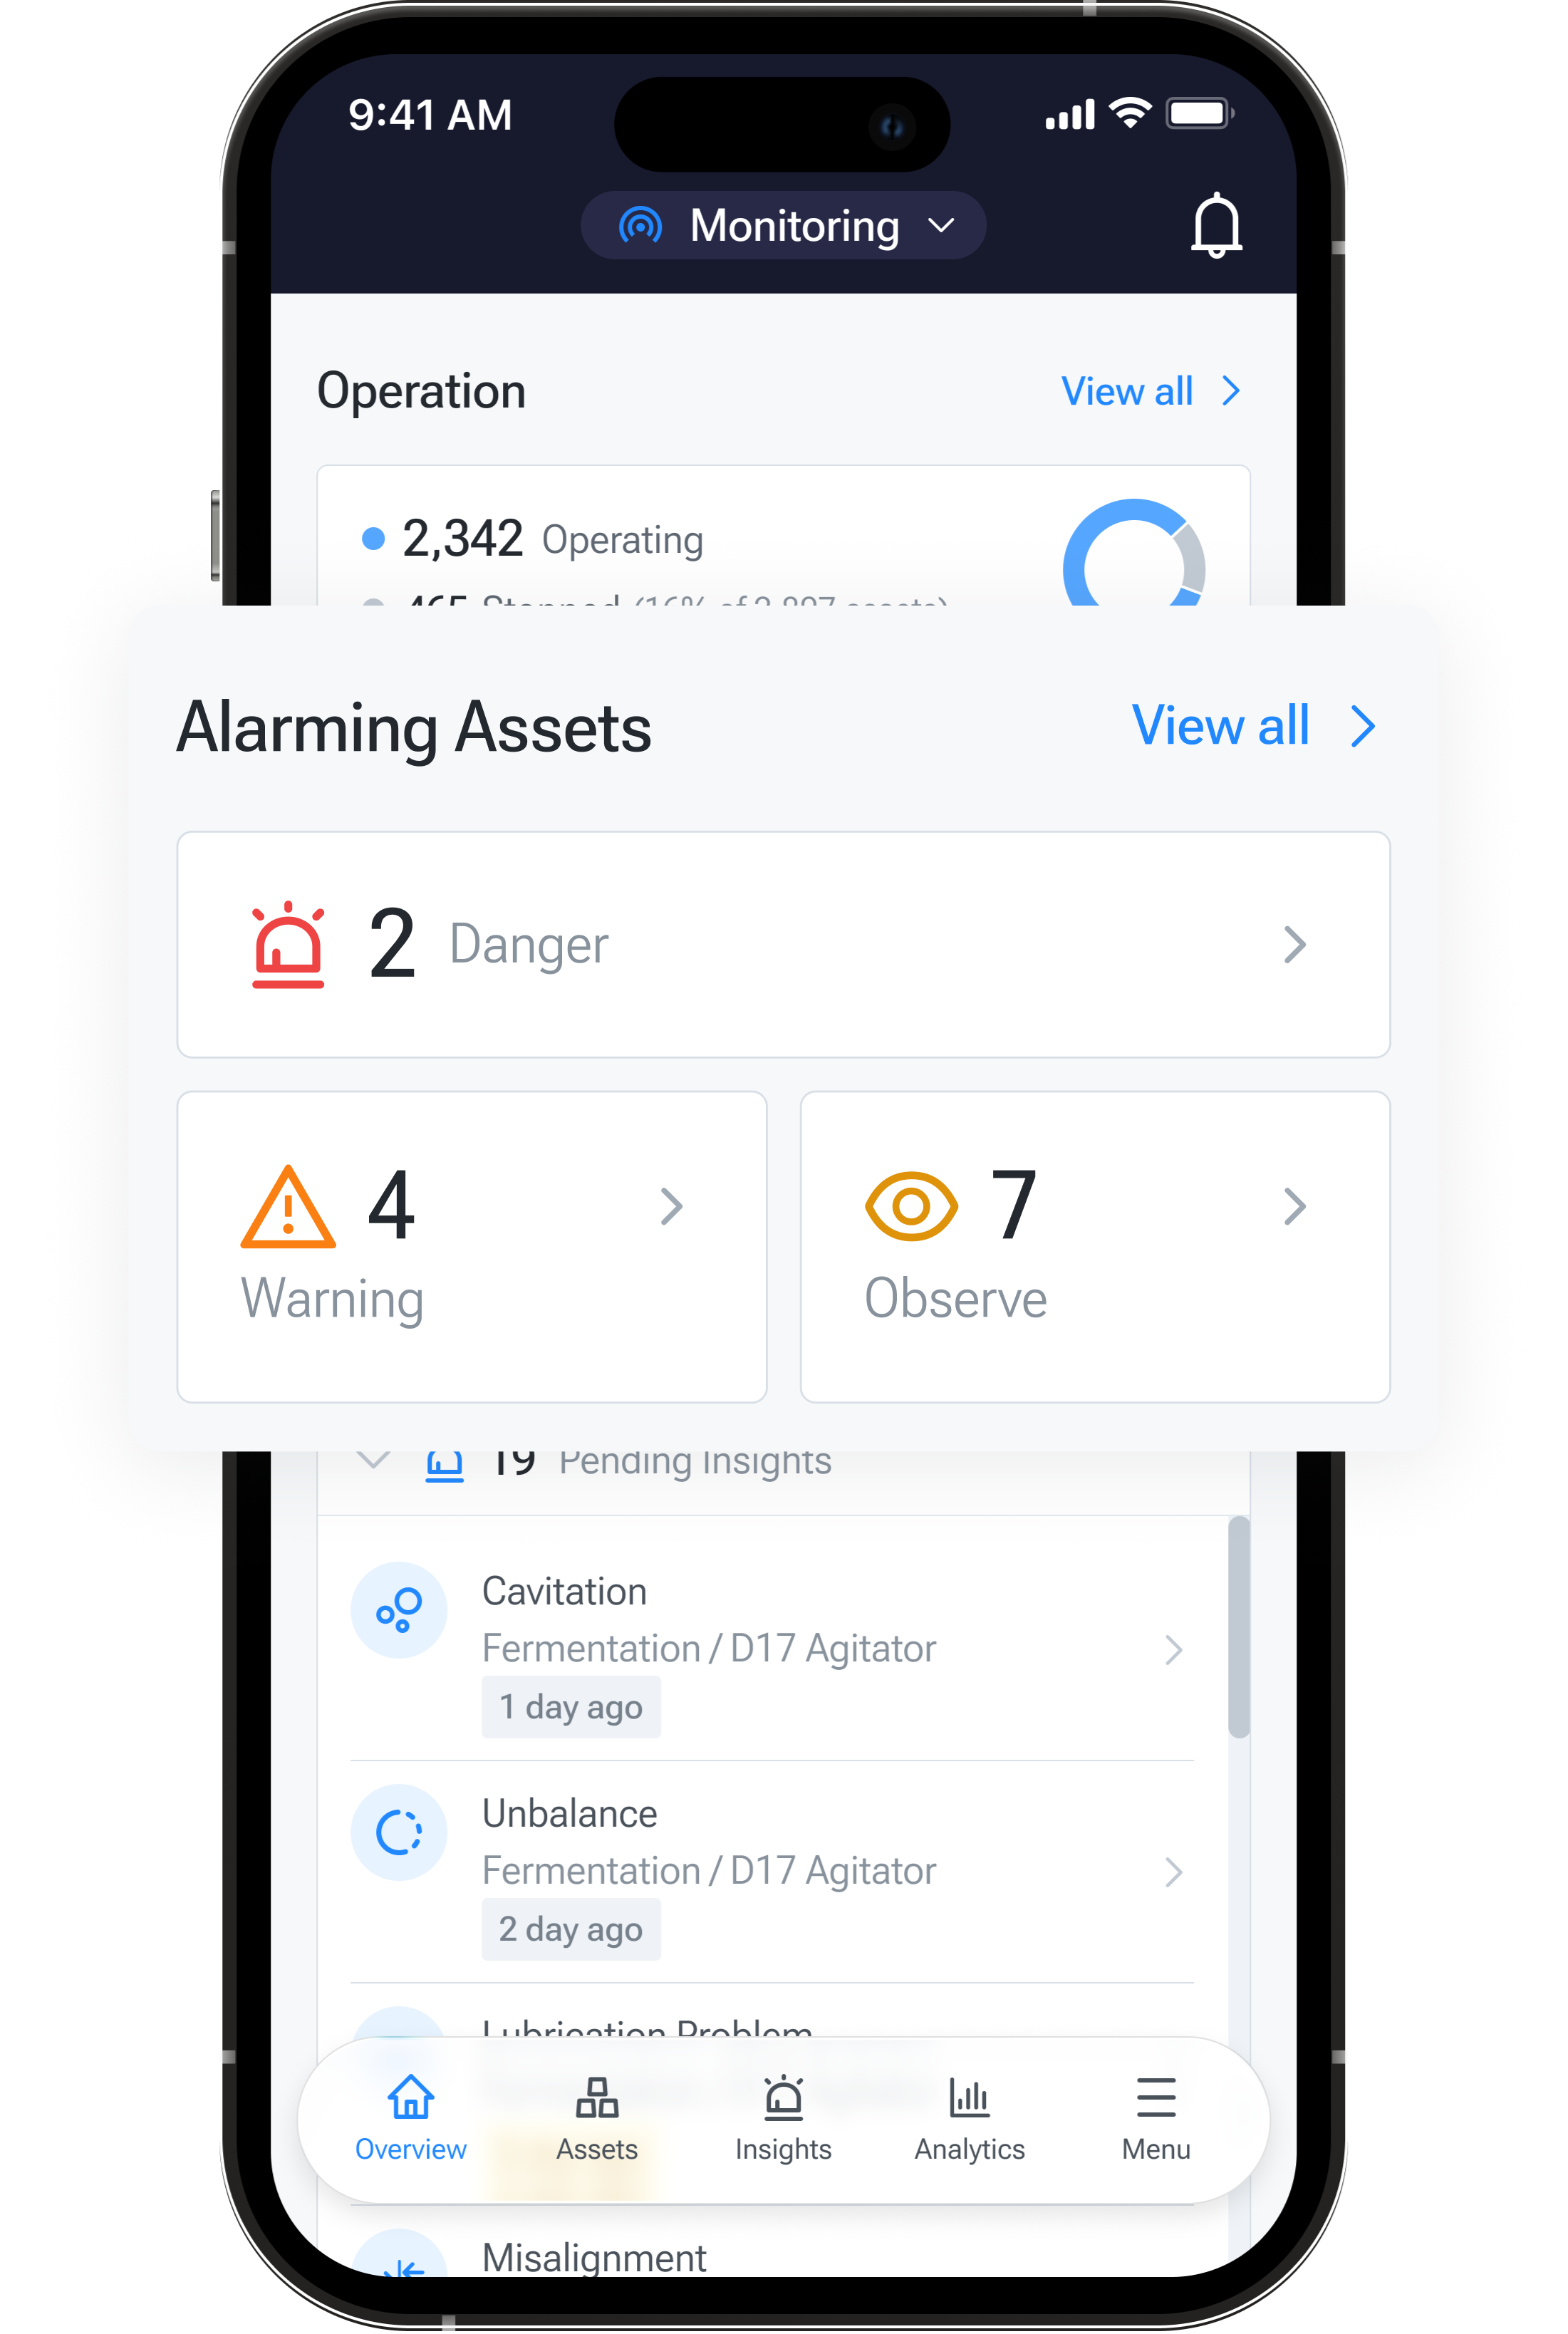
Adapting desktop content and developing a dedicated application for each device are completely different things. We understood what mobile device users would need in their context and created an interface aimed at identifying the problem and acting. Now in a prioritized and organized manner.
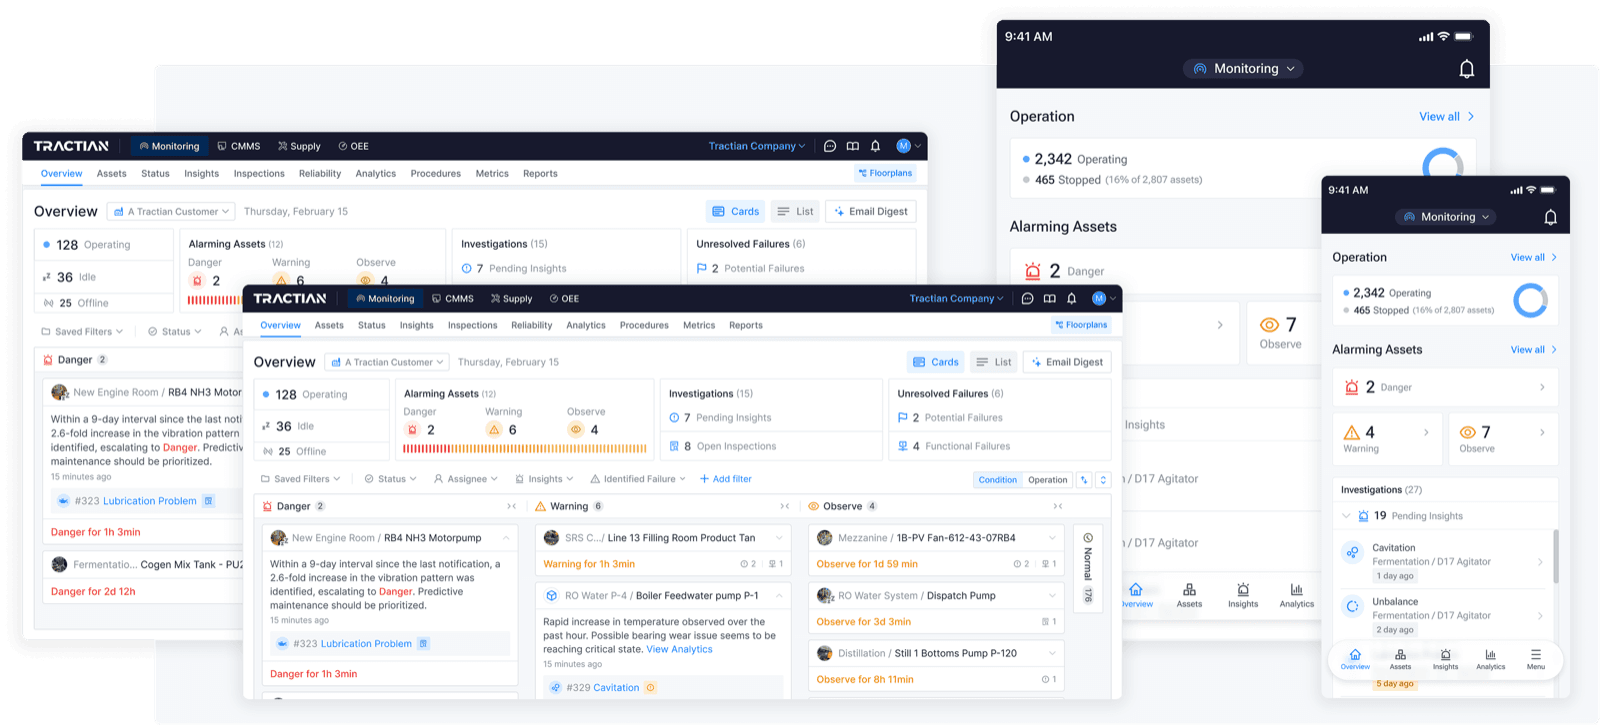

Navigable mobile prototype
Designed to ensure precision in the smallest details